Occupational noise annoyance and sensitivity as potential contributors to oxidative stress in metal industry workers
Study sample
The participants in the present study were male workers in a metal parts manufacturing industry located in the west of Tehran, Iran. From 2019 to 2021, this study focused on 450 production line workers working 8 h a day and 5 days a week. The number of subjects was calculated according to a statistical formula reported by Daniel et al., and the statistical variables of the formula were chosen similarly to another study16 with a probability of 70% and a precision of 7%. According to the calculated sample size, 161 persons were selected randomly with exclusion criteria of cardiovascular diseases, AIDS, hepatitis, diabetes, head injury or hearing impairment, smoking habits, and alcohol consumption, and use of medicinal supplements for 72 h before blood sampling and noise exposure.
Ethics approval for research
Ethical considerations in the present study were adapted to the provisions of the Declaration of Helsinki and the principles of trust, while keeping the confidentiality of people’s information. Subjects were informed about the objectives of this study. All participants entered the study with full knowledge of their rights and after completing the informed consent form. Participants were also informed about the confounding and stress factors affecting the results of this study.
Consent for participation
This study was approved by the Ethics Committee of Iran University of Medical Sciences with the ethical approval code: [IR.IUMS.FMD.REC 94-04-27-26845].
Measuring the sound level equivalent to 8 h individually (LEP, d-8 h)
Due to the variability of participants’ workplace during the working day, in the first step, the type and duration of workers’ tasks were individually determined, and in the second step, the sound equivalent level was measured for each group of people with the same work nature using a calibrated noise level meter (Brüel & Kjær Co., Type 2339 Sound Level Meter, Denmark). The average level of noise exposure of each subject was estimated using the following formula:
$$\:LEP.d=10\:log\:\left[\frac{1}{8}\sum\:{t}_{i}\times\:{10}^{\frac{{L}_{i}}{10}}+\dots\:+{t}_{n}\times\:{10}^{\frac{{L}_{i}}{10}}\right]$$
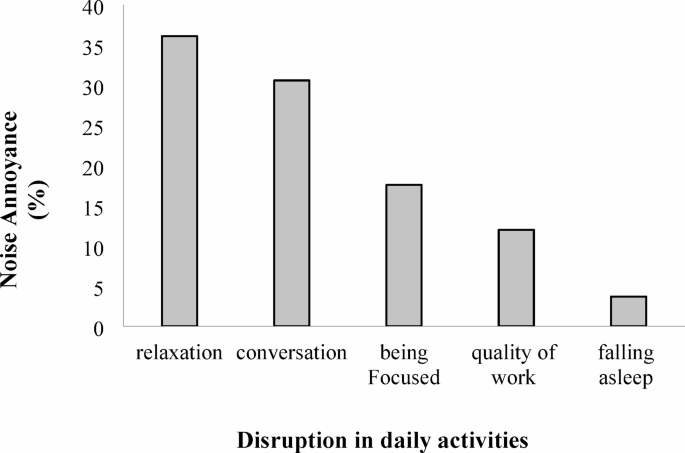
Where LEP, d, ti, and Li, are, respectively, full shift equivalent sound pressure level (dBA), exposure time of ti activity (hr), and equivalent sound pressure level (Leq) for the tn activity (dBA). The impact of noise exposure on disruption in people’s daily activities, including the quality of their work, being relaxed and focused, alertness, and conversing, was recorded in a questionnaire by asking the participants.
Evaluation of noise sensitivity and noise annoyance
In the present study, the Weinstein Noise Sensitivity Scale (WNSS) was used to measure individual noise sensitivity, investigated by Alimohammadi et al.17, reported validity and reliability of 0.77 and 0.78, respectively. The WNSS questionnaire consists of 21 questions to determine a person’s reactivity to noise, and each question is answered with the help of six qualitative expressions of emotion, which receive a score of 0 to 5. In the present study, scores ≤ 55, 56–72, and ≥ 73 were considered equivalent to low, medium, and high noise sensitivity, respectively. The demographic characteristics section of the WNSS questionnaire was used to record the age, education level, and work experience of each participant.
Noise annoyance in the participant was collected using the International Organization for Standardization ISO/TS 15666:2003 questionnaire18. The ISO-15,666 questionnaire consists of 20 questions. It is possible to answer each question of the ISO-15,666 questionnaire with 5 qualitative expressions that report the level of discomfort from the noise exposure as not at all, slightly, moderately, a lot, and very much. In the present study, qualitative expressions for noise annoyance were limited to three general responses: low (equivalent to not at all and partial), medium, and high (high and very high) noise annoyance levels.
The method of blood drawing from participants
Fasting blood samples were collected from the participants in sterile test tubes, and the serum was separated by centrifugation according to standardized procedures recommended by the Early Detection Research Network19. The serum was then transferred into 1 ml RNA-free and DNA-free microtubes and stored at − 80 °C until analysis.
Measurement of malondialdehyde (MDA)
MDA is routinely considered an oxidative stress biomarker that is generated by lipid peroxidation. The measurement of MDA concentration in the blood serum sample was performed using the ZellBio chemical colorimetric kit (MDA assay kit; ZellBio GmbH, Catalog No: ZB-MDA 96 A, V405, Ulm, Germany) and according to the manufacturer’s protocol. The pink color produced by the reaction of MDA and thiobarbituric acid at a temperature of 90–100 °C, indicates the concentration of MDA, which was read at a wavelength of 535 nm using an Eliza reader device (Bio-Tek EL×800 Microplate Reader, USA).
Measurement of total antioxidant capacity (TCA)
TCA is an indicator for the measurement of the free radical’s removal rate from biological samples. ZellBio colorimetric kit (TCA assay kit; ZellBio GmbH, Catalog No: ZB-TAC 96 A, V4527, Ulm, Germany) was used to measure TCA concentration in blood serum. The measurement of the blue color intensity caused by the reduction of Fe+3 to Fe+2 by antioxidant compounds at 490 nm wavelength by an ELISA reader (Bio-Tek, USA) was considered as an indicator of TCA concentration in the blood serum biological sample.
Measurement of 8-hydroxy-2′-deoxyguanosine (8-OHdG)
8-OHdG has been introduced as a useful index for the evaluation of oxidative damage to DNA, which causes carcinogenesis. 8-OHdG concentration was measured using a ZellBio Enzyme-Linked Immunosorbent Assay kit (8-OHdG assay kit; ZellBio GmbH, Catalog No: ZB-10187 S-M9648, Ulm, Germany) and according to the manufacturer’s instructions. The concentration of 8-OHdG was measured by an ELISA reader (Bio-Tek, USA) at a wavelength of 450 nm and in ng/ml.
Statistical analysis
All statistical analyses were conducted using Statistical Package for the Social Sciences (SPSS) version 18. Descriptive statistics, including means with standard deviations and percentages, were applied to summarize participants’ demographic characteristics and noise exposure levels. To examine the relationship between noise exposure and outcomes, multiple linear regression analyses were performed. Specifically, these analyses assessed the association between noise exposure (as the independent variable) and two outcomes: noise sensitivity and noise annoyance. In a second set of regression models, noise sensitivity and noise annoyance were considered independent variables, and their relationship with oxidative stress biomarkers—namely MDA, TAC, and 8-OHdG—was explored, while adjusting for potential confounding demographic factors including age, education level, and work experience. Additionally, one-way ANOVA tests were employed to compare the levels of oxidative stress biomarkers across categorized levels (low, moderate, and high) of noise sensitivity and noise annoyance. A P-value of less than 0.05 was considered statistically significant in all two-tailed analyses.
link