


Dataset characteristics
A total of 45,789 patient self-reported free-text descriptions were labeled 78,111 times out of a master list of 598 unique labels. Across the dataset an average of 1.79 labels was applied to each record as shown in Fig. 2. The max number of labels on one patient self-report was 14. The distribution is right skewed with 62% of records containing one label, 19% containing two labels, 10% containing three labels, 5% containing four labels, 2% containing five labels, and 1.5% containing six or more labels Fig. 2. The top ten labels were fever (7.52%), headache (4.62%), sore throat (4.01%), cough (3.41%), no symptom (i.e., looking for something else—3.36%), runny nose (2.68%), weakness and fatigue (2.67%), abdominal pain (2.34%), covid-19 (1.89%), and nasal/sinus pain (1.75%) (Fig. 3a). The top 24 most frequently applied labels accounted for 50% of all applied labels; the top 91 for 75% of all applied labels; the top 214 for 90% of all applied labels; the top 316 for 95% of all applied labels; and the top 455 for 99% of all applied labels. 143 more labels accounted for the remaining 1% (Fig. 3b). Thus, three-quarters of patients searched for one-fifth of the possible labels.

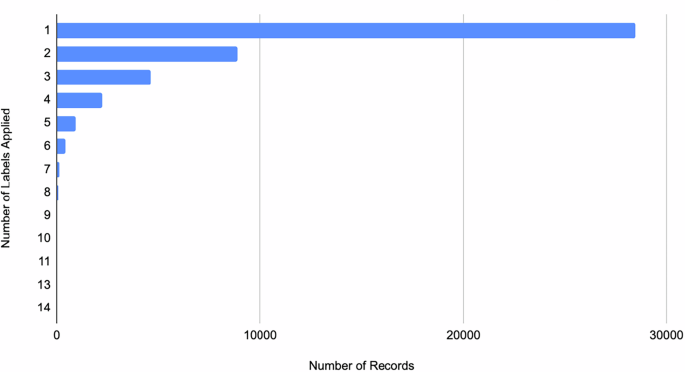
81.5% of all searches had one or two symptoms/needs in them. 92% of all searches had 3 or less symptoms/needs in them. 98.5% of all searches in the initially acquired set had 5 or less symptoms/needs in them.

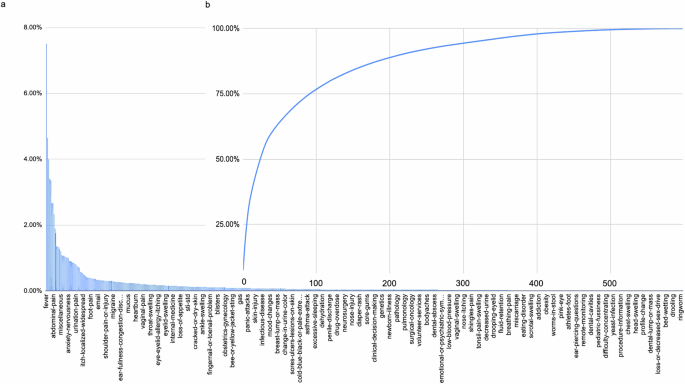
In the training set a individually and b accumulating. The top 100 classes accounted for 75% of all volume. The top 200 for about 90%. With well over 500 possible classes labeled. Classes with less than 30 examples were omitted for training resulting in a total of 506 classes within the model.
Model performance evaluation and thresholding
Model performance was evaluated with the understanding that three-fourths of patients searched for one-fifth of possible labels (see above in Dataset Characteristics). Thus, the health systems to be utilizing the model found it proportionately more important for the model to perform well on those symptoms or needs searched more often by patients. Average performance of the model as a function of an increasing number of included classes is shown in Table 1 and ranged from a recall = 0.93, precision = 0.91, and F-score = 0.92 in its performance in classifying the most prevalent search and declined as the model included upwards of 300 classes to recall = 0.71, precision = 0.69, and F-score = 0.70 in each performance metric. Average performance on the top 24 most frequently searched classes (50% of all searches) was recall = 0.84, precision = 0.78, F-score = 0.80; on the top 91 (75% of all searches) was recall = 0.76, precision = 0.72, and F-score = 0.73; on the top 214 (90% of all searches) was recall = 0.73, precision = 0.70, and F-score = 0.71; and on the top 95% was recall = 0.71, precision = 0.69, and F-score = 0.70 (Table 1). Average performance on the top 24 most frequently searched non-symptoms was recall = 0.61, precision = 0.74, and F-score = 0.69; on the remaining 81 was recall = 0.79, precision = 0.79, and F-score = 0.77. Global confusion matrices are also provided in the Supplemental Material.
Because the system was intended for patients to manually affirm or select their chief complaint with ease, a threshold was needed to determine the subset of labels to offer to patients to select from. To evaluate an appropriate threshold, we examined the average probability outputted for correct labels (0.8872, standard deviation of 0.2176, 95% CI = 0.46–1) and compared it to the average probability outputted for incorrect labels (0.0370, standard deviation of 0.1189, 95% CI = 0–0.27) (Fig. 4). No overlap in the 95% confidence intervals of the two suggested statistical significance between the two means. Thus, to maximize recall, a threshold of 0.46 was chosen as the bottom of the range of outputted probabilities for correct labels.


Displayed as a histogram of confidences for correct vs. incorrect classifications. The 95% confidence intervals do not overlap indicating statistically significant difference between the model’s correct classifications vs. incorrect ones. These 95% confidence intervals informed the thresholding to be applied when deciding whether to display a classification to the user to affirm/deny.
Health system deployment and outcomes
The model was utilized 887,640 times in the data collection period (March 2020–March 2024) after deployment across 15 health systems of varying scale (including national) (Table 2). The model was utilized in all 50 states, Puerto Rico, and the U.S. Virgin Islands (Fig. 5). 46.23% of all classified free-text inputs were classified with one label rising above the selected probability threshold. 50.09% of all classified free-text inputs were classified with multiple labels rising above the selected probability threshold. 3.43% of all classified free-text inputs had no results exceed the label threshold (Table 3). The top 10 classifications, in descending order, were covid-19 (7.4%), cough (6.3%), sore-throat (5.4%), fever (5.1%), headache (5.0%), abdominal-pain (3.9%), congestion (3.0%), back-pain (2.8%), weakness-and-fatigue (2.7%), and myalgia (2.5%) (Table 4). The middle 10 classifications, in descending order, were spider-bite (0.0140%), genital-rectal-itching (0.0138%), pediatrics (0.0138%), nose-allergies (0.0136%), tongue-discoloration (0.0134%), dental-abscess (0.0131%), penile-discharge (0.0130%), vaccine-record (0.0128%), gluteal-pain (0.0116%), and muscle-cramps (0.0116%). The bottom 10 classifications, in descending order, were plastic-surgery, pneumonia-vaccine, respiratory-infection, rib-injury, skin-discoloration, smoking, snake-bite, stuttering, tumor, and white-discharge (all 0.000135%).


a Distribution of NLP use across the USA b 2020 Census population distribution (source: census.gov). Notice the consistency of use with the hotspots shown in the Census data. One area with greater use than apparent population density was Florida. This was largely due to the COVID-19 pandemic.
This natural language classification system was used to power a variety of capabilities for health systems across the USA including hundreds of thousands of self-navigations + triages of patients. For example, one of the health systems to use it set up a nurse triage line to help navigate patients as they were calling in with concerns during the COVID pandemic13. However, this phone line was overwhelmed during the COVID pandemic. The Chief Medical Information Officer (CMIO) of this system endorsed wait times of up to an hour to talk to a nurse (average of 32 min across the state of Florida)13,14. Virtual self-triage capabilities powered by the natural language processor decompressed nurse triage lines and reduced the wait times of it to typical levels13. Satisfaction measurement of 1,357 randomly polled patient users revealed satisfaction scores out of a maximum scale of 10 in a distribution where ~50% of all raters scored the experience a 10 out of 10 and ~75% of all raters scored the experience an 8, 9, or 10 out of 10 (Fig. 6). The detailed distribution is as follows: 10 (49%), 9 (12%), 8 (14%), 7 (6.1%), 5 (4.7%), 4 (.52%), 3 (1.3%), 2 (2.1%), and 1 (5.4%). The cost of a patient encounter handled by virtual self-triage was measured to be $3.92 per encounter (which decreases as its use scales upwards) as compared to the cost of a call-center based nurseline triage encounter which ranges from $20 to 40 per encounter (5–10× more)15.

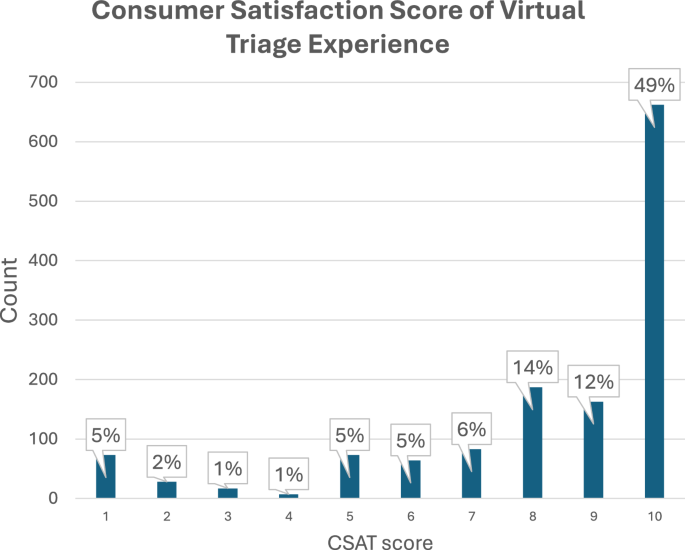
Satisfaction measurement of 1,357 randomly polled patient users revealed satisfaction scores out of a maximum scale of 10 in a distribution where ~50% of all raters scored the experience a 10 out of 10 and ~75% of all raters scored the experience an 8, 9, or 10 out of 10 (Fig. 6). The detailed distribution is as follows: 10 (49%), 9 (12%), 8 (14%), 7 (6.1%), 5 (4.7%), 4 (.52%), 3 (1.3%), 2 (2.1%), and 1 (5.4%).
Demographic analyses uncovered that age, sex, and location (state) all had statistically significant effects on the accuracy of the supervised NLP model. Not knowing user age correlated significantly with lower model accuracy (known = 89.64% vs unknown = 83.03%, p < 0.0001) (Fig. 7). This was likely because age is only asked about in conversations in which it was necessary to determine a clinical outcome (e.g., triage). As a result, there is almost 5x more data without age than there is with. Among interactions where age was known, certain age bands were correlated with statistically significant differences in supervised NLP model accuracy compared to the global average (i.e., 0–9, 20–29, 50–59, and 90–99) (Fig. 7). Though, there was not a clear trend or rationale as to why with these age bands. Known female sex was associated with statistically lower supervised NLP model accuracy as compared to known male sex or unknown sex (female = 86.72%, male = 89.20%, unknown = 88.68%) (Fig. 8). Finally, user location correlated with statistically significant differences in supervised NLP model accuracy in 5 states (i.e., CO, FL, MA, MS, and TX) (Fig. 9). Though, there is also an unclear trend with two of these states being the top two states of usership (FL and TX).

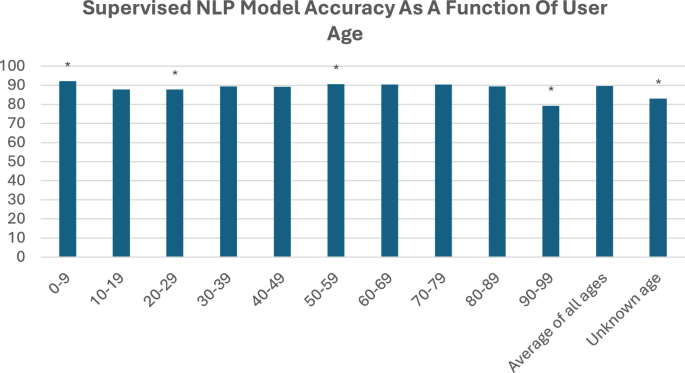
Not knowing user age correlated significantly with lower model accuracy (known = 89.64% vs unknown = 83.03%, p < 0.0001). This was likely because age is only asked about in conversations in which it was necessary to determine a clinical outcome (e.g., triage). As a result, there is almost 5x more data without age than there is with. Among interactions where age was known, certain age bands were correlated with statistically significant differences in supervised NLP model accuracy compared to the global average (i.e., 0–9, 20–29, 50–59, and 90–99). Though, there was not a clear trend or rationale as to why with these age bands.

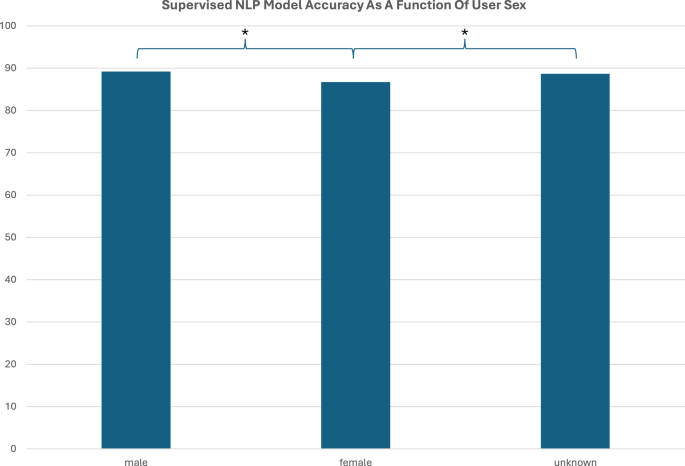
Known female sex was associated with statistically lower supervised NLP model accuracy as compared to known male sex or unknown sex (female = 86.72%, male = 89.20%, unknown = 88.68%).

Finally, user location correlated with statistically significant differences in supervised NLP model accuracy in 5 states (i.e., CO, FL, MA, MS, and TX). Though, there is also an unclear trend with two of these states being the top two states of usership (FL and TX).
The natural language processor was also used to match patients to appropriate workflows for care. For example, patients who received a COVID diagnosis were matched to a virtual symptom tracker that remotely monitored 7000 patients simultaneously throughout their COVID journeys13. The CMIO of this system reported, in a publicly available webinar, of a patient who was identified to be having severe COVID symptoms and could not breathe enough to talk via the phone13. Using digital technology powered by the natural language classification system, the patient reported their symptoms, was flagged by the healthcare system, who called the patient, realized they were having trouble breathing, called EMS who arrived to the patient’s residence, and within minutes of EMS’ arrival, resuscitated the patient as they coded in the field. The patient was intubated, revived, brought into the emergency department, and nursed back to health, ultimately surviving13. The CMIO endorsed that this patient would not have survived if not for the presence of the digital symptom tracker enabled by the natural language classification system reported here13.
Challenges during deployment on the digital properties of health systems at varying scales included the range of web development resources available at the health systems to support implementation, that the NLP classifier alone was not valuable without clinically validated triage for it to match users into, the risk thresholds of the executives responsible for making decision to deploy automation for patient decision support, variations in how health systems preferred to allocate resources when displaying results pages, the readiness of health system online scheduling, and the cycle time for retraining the NLP classifier towards iterative improvement.
Comparison to a baseline bag of words model and then to a pre-trained, general LLM
In comparing the supervised NLP model to a baseline bag of words model, the supervised NLP model performed ~30–40% better in each metric on a common test set. On the same test set, the bag of words model performed with a precision of 0.52, recall of 0.60, and F-score of 0.55 while the supervised NLP model performed with a precision of 0.72, recall of 0.77, and F-score of 0.74 (Table 5).
GPT-4 was evaluated for its ability to classify 1000 records according to the same master list of labels used to annotate the supervised NLP model’s underlying dataset. The supervised NLP model performed with a recall of 0.80, precision of 0.78, F-score of 0.79, and accuracy of 0.80. GPT-4 performed similarly with a recall of 0.80, precision of 0.81, F-score of 0.80, and accuracy of 0.80 (Table 6). Given that the performance metrics for the supervised NLP and GPT-4 are very close statistical significance was evaluated to determine whether these differences reflect meaningful performance differences.
Paired t-tests on the individual classification outcomes revealed that the differences in recall (∆ = 0.008, p = 0.53), precision (∆ = 0.0252, p = 0.047), and accuracy (∆ = 0.008, p = 0.53) between GPT-4 and the supervised NLP did not reach statistical significance (p < 0.05 across all tests) suggesting that the overall performance of GPT-4 and the supervised NLP model is statistically comparable (when GPT-4 is provided a curated master list).
Use of an LLM to annotate missed classifications
To evaluate an LLM’s ability to support gaps in the supervised model’s classification performance, GPT-4 was evaluated for its utility in labeling patient-reported queries that were unable to be classified by the supervised NLP model. This was done using a set of 3459 patient self-reported queries from health system search bars that were unable to be matched by the implemented supervised NLP model. The data set was labeled by human annotators. GPT-4 was prompted to label the same dataset, blinded from the human annotations, and using the same master list of labels that the annotators used.
The LLM’s accuracy, recall, precision, and F score in labeling new data as compared to human annotation as a gold standard is shown in Table 7. Notice that across all classes performance is ~0.60-0.70 depending on the performance metric. Digging into the per-class performance, we see the results shown in Fig. 10a and Fig. 10b. Notice how there is a smooth distribution of individual classes performing near 1.00 all the way down to near 0 performance Fig. 10c. We ask if those classes with near 1.00 performance in one metric were also the ones with near 1.00 performance in the others. Fixing the order of classes to that of one of the metrics gives us our answer in Fig. 10d. In Fig. 10d, the order of classes in the Precision and in the F-score plots are mapped to the same order as the Recall curve shown in Fig. 10c. Again, the Recall curve is plotted in order of highest Recall to lowest (hence the smooth curve). Figure 10d tells us that the classes with high Recall are not necessarily the classes with high Precision and likely vice-versa. Figure 10 and Table 8 show us the distribution of classes with high performance in 0, 1, 2, or 3 performance metrics respectively. ~21% of classes were labeled with high precision, recall, and F-score. The remaining classes were labeled with high performance in 0, 1, or 2 areas.


When the supervised NLP did not output any classes of sufficient confidence, GPT-4 was used to attempt to classify the search and compared to a human annotated gold standard. a Distribution of classes performing above 0.75 when labeled by GPT-4. GPT-4 was used to label otherwise unclassified searches. In ~20% of classes, GPT-4 performed at >0.75 in all three-performance metrics (recall, precision, and F-score) b Distribution of classes performing above 0.75 in precision and/or recall only when labeled by GPT-4. Because (a) does not specify which performance metric(s) were >0.75 and because F-score is a ratio of precision and recall, the aim of this panel is to remove the dependent performance metric and provide a view of the data in terms of only precision and recall. c Visualizing recall, precision, and F-score of each class in descending order when GPT-4 is used to label otherwise unclassifiable searches. c Shows different class orders for Recall, Precision, and F-score. d Visualizing recall, precision, and F-score of each class in descending order when GPT-4 is used to label otherwise unclassifiable searches. d Fixes the plotted class order to the same order as the Recall curve demonstrating that recall and precision is not quite correlated among classes.
link